What is homelessness?
The Australian Bureau of Statistics (ABS) defines Homelessness as the following:
When a person does not have suitable accommodation alternatives they are considered homeless if their current living arrangement:
- is in a dwelling that is inadequate; or
- has no tenure, or if their initial tenure is short and not extendable; or
- does not allow them to have control of, and access to space for social relations.
 Another common definition, often used by various Australian government departments and in the NGO sector is that there are three types of homelessness.
Primary—when there is no conventional accommodation, e.g. sleeping rough on the streets, or crisis nightly accommodation in centres or hostels. Sleeping rough is the least common form of homelessness in NSW with 7% of people living this way, while 18% will access supported accommodation.
Secondary—people are not generally sleeping rough but have no fixed accommodation so are frequently moving from one temporary shelter to another. This kind of homelessness is often hidden. e.g. ‘couch surfing’. About 18% of people experiencing homelessness in NSW will stay in households not their own.
Tertiary—people generally have fixed accommodation but in dwellings that fall below minimum community standards. E.g. boarding houses, overcrowded places, or caravan parks not set up for long-term mobile home living. In NSW living in overcrowded dwellings is the most common experience of homelessness, with 34% of the homeless population living this way. Boarding house accommodation is the second most common form with 34% of homeless people finding shelter in that form.
Often, both of these definitions dovetail and inform each other.
WHO IS HOMELESS?
NSW
In 2021 Census data released that 122,494 people were experiencing homelessness in NSW. 2,508 of this cohort were Indigenous Australians.
A More Local View
Homelessness NSW has broken down the experience of homelessness by Local Government Areas, so you can see how your council area is faring. Often, knowing what is going on in your local area makes the problem seem so much more solvable so you can realistically get some action organised that can have real impact. Check out your Council’s website for more information and any Registry Activities (these are head-counts of people experiencing sleeping rough by teams of people from councils or local organisations). Look into local homelessness and housing crisis services and see how you can get involved and be part of the solution.
Nationally
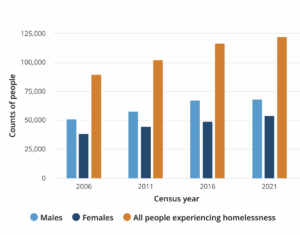
On 2021 Census Night 122, 494 people were homeless, that’s an increase of 6,067 people since 2016. The rate of homelessness decreased to 48 people, per every 10,000.
In 2021, the rate of Aboriginal and Torres Strait Islander homelessness in Australia was 24,930 people, going up by 6.4%.
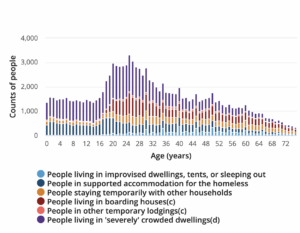
55.9% of the people experiencing homelessness were male, and 44.1% female. Nearly 20.8% of the group are aged under 35, and this age cohort accounted for most of the homelessness increase.
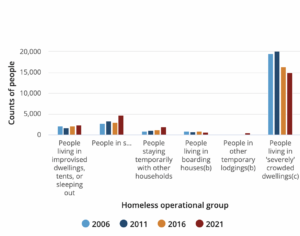
Severely overcrowded dwellings are the main place of accommodation, making up 52.0% of the homeless population.
WHY ARE PEOPLE HOMELESS?
People generally experience homelessness after a sequence of related events and a mix of systemic, economic, societal, familial and personal issues. Some of the reasons people find themselves homeless include, financial difficulties, lack of adequate affordable housing, discrimination, health reasons as well as because of issues related to reintegrating into society after a custodial sentence. Domestic violence continues to be one of the major factors for homelessness, especially amongst women and children.
 *Unless otherwise referenced, the figures and images in the section above are based on the 2021 Census. ABS data can be found directly here; Info-graphs and corresponding data from Australian Bureau of Statistics.
Housing Affordability and Homelessness
Housing affordability is a key element of understanding homelessness because it is a major reason people experience homelessness but is also often central to homelessness created by domestic violence and financial difficulties. Families leaving violent situations usually need secure and affordable housing to make the separation possible, while at the same time they are often facing financial difficulties due to inability to work, and the challenges created by disrupted emotional lives, isolation and child-caring responsibilities.
 That family violence and housing affordability are major issues at state and national levels also helps to explain why so many young people are homeless. The effects of increasing rental prices, insecure work or under-employment both during and after tertiary or vocational studies as well as the effects of family violence on children’s education, capacity to gain post-school skills and long-term mental and emotional health are all major factors for homelessness across the 0-34 age bracket.[1]
More Information and Getting Involved
- For more information and to get involved, click here.
- To learn what the Church teaches on housing and homelessness, click here.
- To learn more about the specific homelessness and affordability crisis in Sydney, click here.
References
[1] David MacKenzie, Paul Flatau, Adam Steen, Monica Thielking, The Cost of Youth Homelessness in Australia, Research Briefing from ARC Linkage Project ‘The Cost of Youth Homelessness’, April 28. 2016, especially 9-15; for more on the overall project see Swinburne University.